Calibration Studies
Differential Nonlinearity Measurement
Research and Technologies for Future Particle Physics Experiments
Differential Nonlinearity Measurement
Experience from the Compton polarimeter used at the SLC tells us that the precision of polarisation measurement is not limited by statistics but only by sys tematic effects. A major source of systematic uncertainty is the Cherenkov detector's linearity, which in turn is strongly dependent on the linearity of the photodetectors ( PD) used. Click here for an overview of the Compton polarimeter and the Cherenkov detector.
In order to achieve the aimed precision of ΔP/P ≈ 0.25% at the ILC, the PD linearity will have to be controlled to a precision of a few 0.1%! Information at this level of accuracy is usually not provided by PD manufacturers. Thus, we have to develop our own appropriate methods to measure and correct PD nonlinearities at the required level.
Ways of Measuring the Nonlinearity
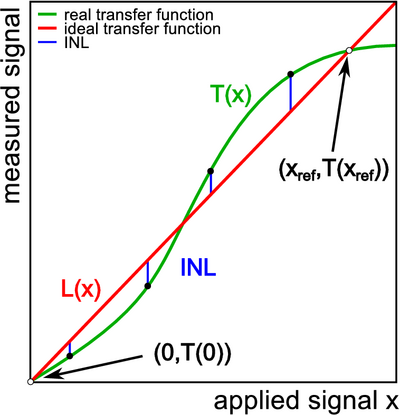
In a conventional calibration of a detector, a well known calibration signal is applied to the detector and the corresponding detector response is recorded. By scanning the dynamic range of the detector with different light intensities, the transfer function of the detector can be measured. Any deviation from a linear response is called integrated nonlinearity (INL) (Figure 1) which needs to be corrected for in later data processing. In order to reach a calibration on permille level, also the light source must be calibrated on this precision, which is technically very difficult.
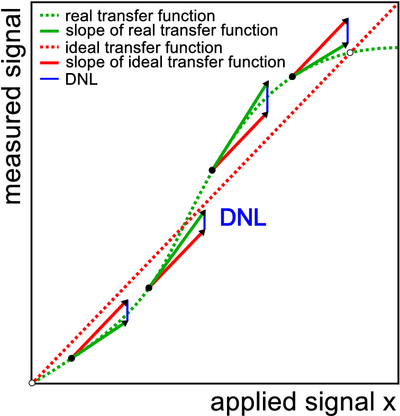
For the photodetectors in a polarimeter, however, only the linear response matters and no absolute calibration is needed. Therefore, an alternative procedure has been developed making use of the measurement of the differential nonlinearity (DNL). In this method the deviation of the slope of the transfer function from a constant is determined (Figure 2).
Technically, the DNL is measured with two light pulses: A base light pulse, which can be tuned in its intensity, and a differential light pulse, which is always constant and small compared to the base pulse. The difference between the base-pulse-only detector response and the detector response of the base+differential light pulse is measured for different base light pulse intensities. For a perfectly linear device, the measured difference should be constant and independent from the chosen base pulse intensity. Any deviation from a constant can be attributed to the detector nonlinearity and, therefore, the measurement can be utilised for constructing a correction function, which linearises the data. Since only differences of signals are measured, the requirements for the light source are strongly reduced. In a Monte Carlo simulation, it was shown that nonlinearities up to 4% can be corrected with this method reliably.
Testing Facility
In order to test this method also experimentally, a testing facility has been set up in a lab at DESY. A schematic picture of the setup and a photo of the testing facility is shown in Figures 3 and 4. Its centerpiece is a light-tight box with an photodetector inside.
The light pulses are generated by a dedicated LED driver, which is capable to produce very short light pulses (<10ns) in the UV range (395nm). It is arranged on an optical bench aligned with the photodetector. There is the possibility to install optical filters in order to attenuate the light reaching the photocathode. The entire setup is controlled via a PC, which also runs the DAQ software using VME electronics.
Photodetector Linearity Measurements
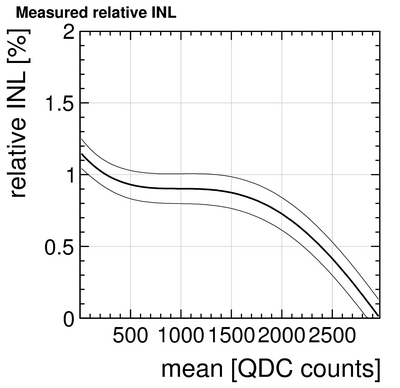
With the described setup it is possible to measure the PD nonlinearity very precisely as shown in Figure 5.Long-term Stability and Calibration
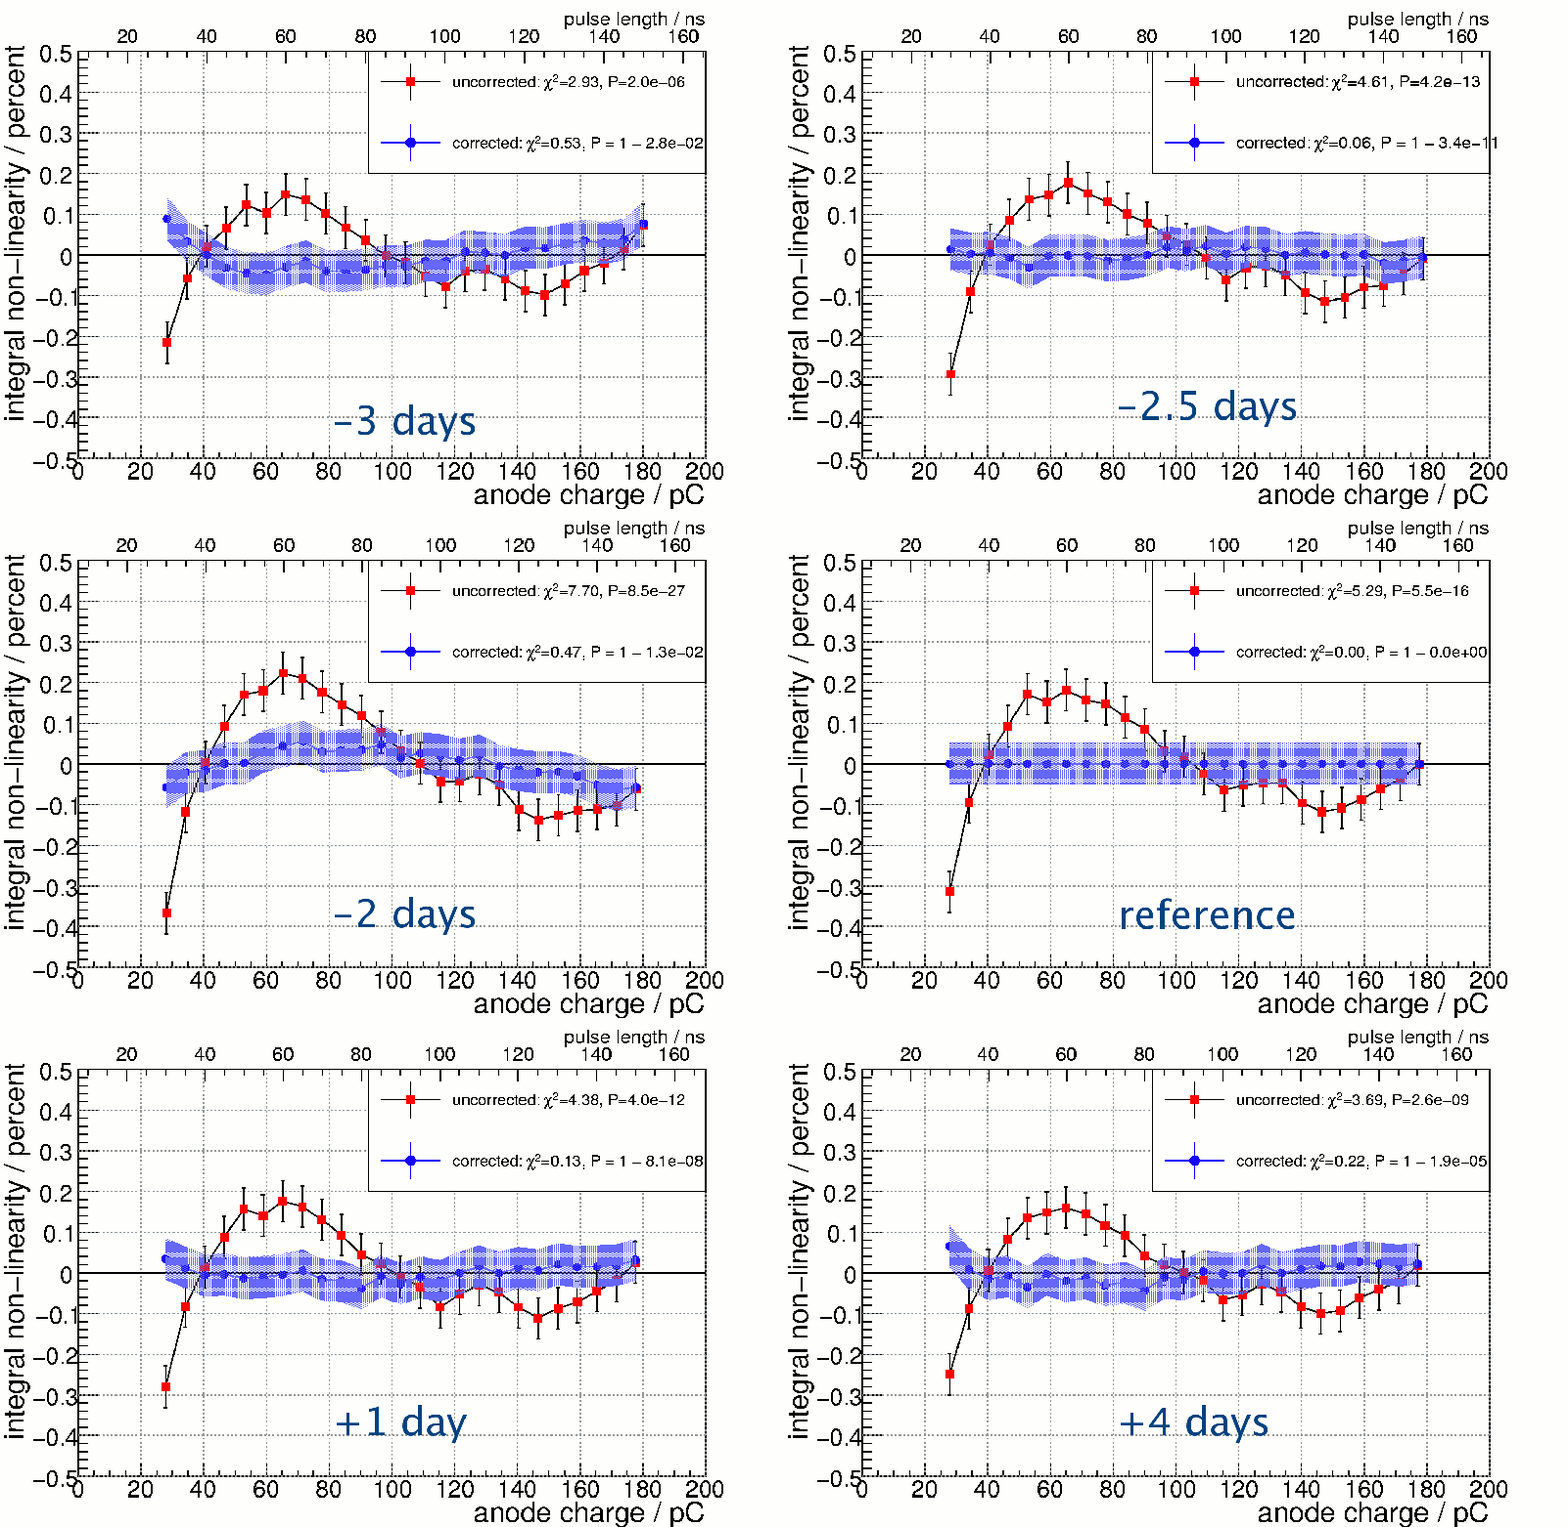
Former studies investigated also the long-term changes of the photodetector nonlinearity. The nonlinearity measurement has been performed in a different setup using a pulse length method. In this method, the LED is directly pulsed with a voltage pulse from a function generator and it is assumed that the pulse length is directly proportional to the amount of light reaching the photocathode of the photomultiplier This INL measurement method has been repeated multiple times. Then one reference method has been chosen and used to correct the others. Figure 6 shows that over a period of 7 days a successful correction of the photodetector's INL is possible.


